Evaluation of SOCRATES2.0
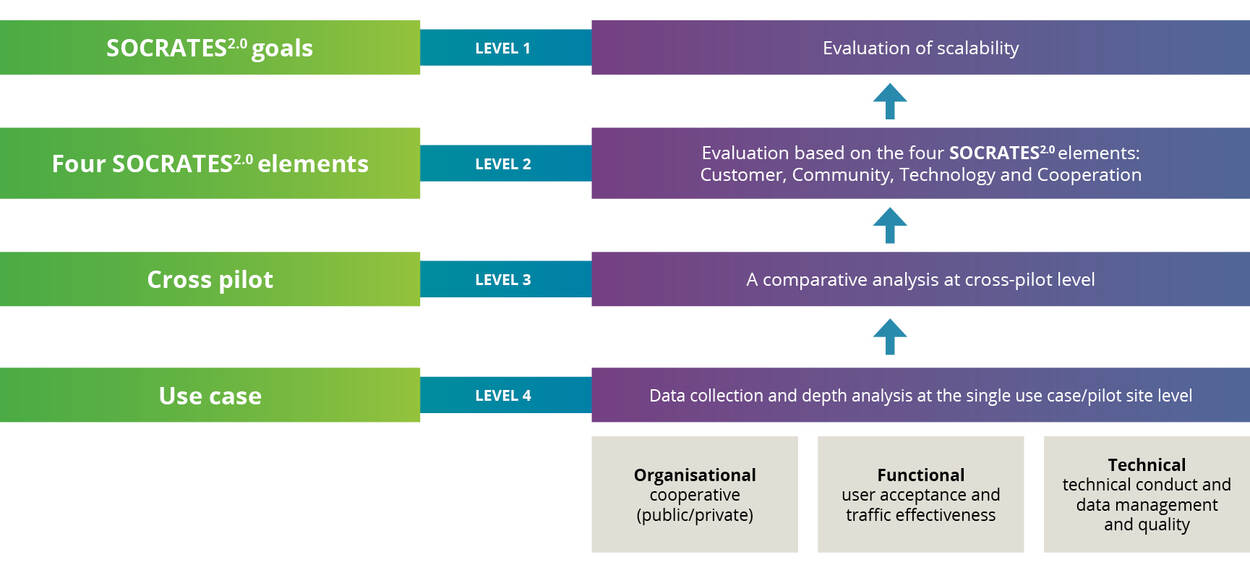
To learn and gain insight on deploying interactive traffic management, the SOCRATES2.0 partners collected and evaluated relevant deployment data and assessed their experiences in the four pilot cities. The results of this evaluation are presented in the SOCRATES2.0 Final Evaluation Report and summarised here.
Sharing data, improving services
Major traffic management improvements require a step-by-step approach. The SOCRATES2.0 partners consider public–private cooperation to be a crucial step in this process. All parties in the project ecosystem were open to cooperation. That is profit in itself.
To start, road authorities should provide public policy objectives (e.g. safe, smart, green), traffic management strategies and response plans. It is important for service providers to be able to explain to their customers why a traffic management measure is needed. However, the availability of such data is no guarantee that private service providers will consider these strategies in their navigation services.
'The availability of such data is no guarantee that private service providers will consider these strategies in their navigation services'
Deploying interactive traffic management in the pilots gave the partners insight into what is essential for successful cooperation. They concluded that the newly developed cooperation models enable cooperation at various levels. This is needed, because a pragmatic or more elaborated model may be more suitable depending on goals, missions and needs of the cooperation. Partners consider the application of one of the cooperation models and their associated intermediary roles to be the main building block for deploying interactive traffic management.
Merging public and private data leads to improved traffic information services, and coordinating these services via the public-private cooperation leverages the potential to increase the number of road users that have access this information. And because road users seem receptive when given the right incentive, this also increases the potential impact on the network performance.
Follow-up actions for making the concept of interactive traffic management sustainable are first and foremost related to finding a win-win-win. The added value for all parties in the ecosystem has not been sufficiently clarified, and there is therefore also a limited view on what the public–private business model could look like. The idea of, for example, an impact-driven business model is promising but needs further exploration.
Impact of new measures and services
'The idea of, for example, an impact-driven business model is promising but needs further exploration'
Within SOCRATES2.0 a mix of regional, specific and generic solutions was created to implement services. The effort required for this proves that actual scalability remains difficult. No two implementations are the same, so the same effort would be required every time an end user service is deployed in a new region. However, the smart routing service coordination seems promising for all parties, as it creates more strategic routing which in turn leads to a smoother, safer and more sustainable traffic flow. And, interestingly, the concept of interactive traffic management can also be combined with a multimodal approach.
The impact of interactive traffic management is highly dependent on the follow-up rate and the user base. SOCRATES2.0 introduced a new feedback loop that allows for the measurement of this type of information from service providers, a necessary component for valuing the impact of new services. When the service providers give traffic management advice, individual road users often trust, accept and respond to this advice. This complements the current methods used to reach road users like road signs provided by road authorities.
Value of the cooperation framework
A well-detailed cooperation framework is essential in interactive traffic management: what could each of the partners contribute to and take from the cooperation? It is also important to agree on the rules of engagement. Trust between parties is essential to make interactive traffic management work. The higher the quality of the data and information shared, the higher the trust in the cooperation and the willingness to accept recommendations. Data exchange is a precondition for upscaling, but standardisation of traffic-related information is needed to make data available (e.g. through a national access point) and organise the exchange. In SOCRATES2.0 a lot of standardisation issues were experienced and are promoted to be dealt with on a larger scale than is currently done.
Deploying interactive traffic management is much more than scaling up innovation. It also requires a mind-shift about the traditional roles and responsibilities of traffic management actors. The role of both road authorities and service providers is changing. Governments continue to play an important role in formulating societal goals, but the service providers are willing and able to make an important contribution to societal goals. Both stakeholders need each other to improve their services for road users, and therefore need to work together as equal partners.
Generating impact: the Be-Mobile Antwerp example
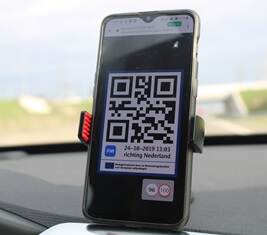
The Optimising Network Traffic Flow (ONTF) service developed in Antwerp offers a new communication channel for sending traffic management strategies to travellers. The ultimate objective is to generate impact on the road authorities’ goal to improve the distribution of traffic over the two tunnels crossing the river Scheldt in Antwerp, by shifting specific travellers from the Kennedytunnel to Liefkenshoektunnel.
Compared to traditional solutions, a huge advantage of the developed service is that it allows for the targeting of individual travellers. Alternative routes can be offered via the Liefkenshoektunnel and corresponding vouchers can be provided for toll-free entry for specific travellers, for example, travellers who had an original route via the Kennedytunnel. This targeted toll reduction is far more cost-effective compared to a general toll reduction. It is also possible to limit the number of shifted
travellers to predefined constraints.
The developed end-user services can create a significant impact on the set objective.
The impact is the result of a number of factors and can be summarised as follows:
IMPACT RATE=OFFER RATE*ACCEPTANCE RATE*FOLLOW UP RATE
The offer rate represents the probability that a user is offered a voucher when they take a route through the Kennedytunnel when the Smart Tunnel Service (or ONTF toll reduction service) is active; the acceptance rate represents the probability that a user accepts the voucher when offered one; the follow-up rate represents the probability that the user will follow-up on the acceptance of the voucher and avoid the Kennedytunnel.
The key takeaways can be summarised as follows:
- The service reached almost 8000 unique users. Uptake of the service was severely impacted by COVID-19 and COVID-19-related measures.
- Almost 70% of trips resulted in a voucher being offered to and accepted by the user. The offer rate is 78%, and the acceptance rate 88%.
- More than two thirds of users ended up avoiding the Kennedytunnel (most taking a route via the Liefkenshoektunnel instead). The follow-up is estimated to be 69%. Follow-up rates are lower when the route via the Liefkenshoektunnel is slower than the original route via the Kennedytunnel, but are still considerable even in this case.
- The data suggests that the service diverts 47% of targeted users away from the Kennedytunnel.
In conclusion, the analysis suggests that the Smart Tunnel Service can have a considerable impact on a traveller’s incentive to take the Kennedytunnel at peak hours. Users will typically be inclined to accept and use a voucher, even if travel times via the alternative route are somewhat higher. The eventual impact on rebalancing the traffic load between the Kennedytunnel and the Liefkenshoektunnel depends on the size of the targeted population. If say 5% of the traffic that intends to go through the Kennedytunnel can be reached, then the analysis suggests that around 2.5% of all traffic can be diverted away from the Kennedytunnel.